Metrics
How would you like to know things like how many times a service has been called, or how many concurrent executions a service has at this moment, or how long it takes a command to be executed?
The MicroProfile Metrics module provides a simple and unified way to publish those and other metrics that you can use to monitor the performance of the application. They are exported in Prometheus format, which means you can use tools like Prometheus or Grafana dashboards to display the data and alerts.
We can get some metrics in our code using the annotations: @Counted, @Timed, @Metered, and @Gauge. We can also create custom metrics by using the annotation @Metric and creating custom histograms.
@Counted(name="StockService.getAll_counter")
@Timed(name="StockService.getAll_timer")
public List getAll(){
//some code here
}
@Timed
public List getByStatus(String status){
//some code here
}
@Metered
public Optional findById(String id){
//some code here
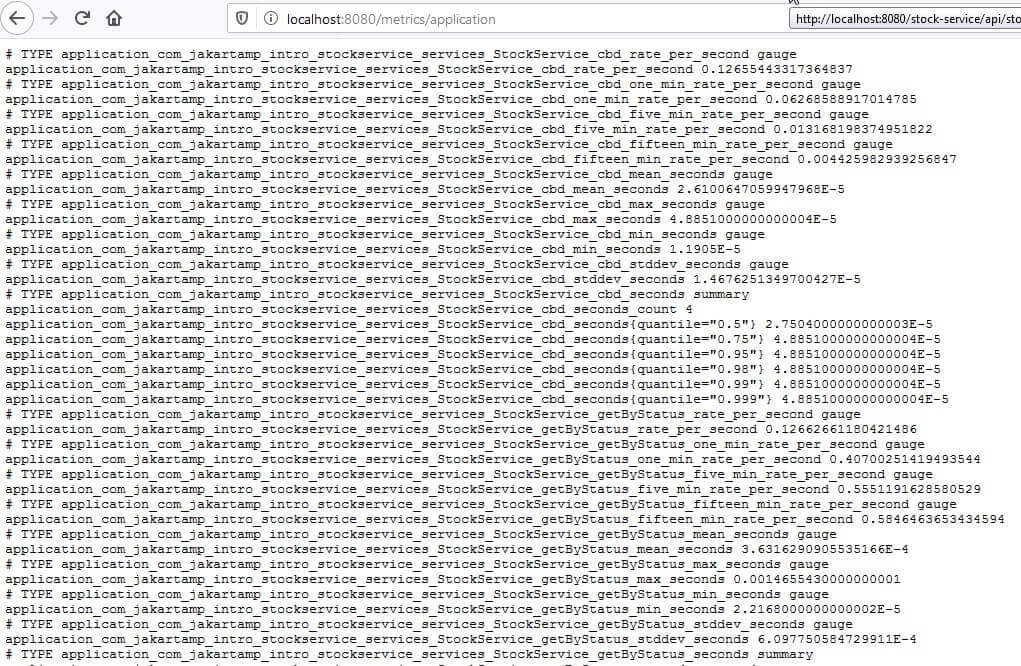
} Finally, we can access the endpoint /metrics/application to get all the metrics exposed by our application. http://localhost:8080/metrics/application