
Docker desktop allow you to have a Kubernetes installation in your local machine, by default it provides most of the features required by a developer. However, metric-server is not part of the built-in features of docker-desktop. It means that if you need or want to access metric-server from your local Kubernetes (docker-desktop), you will need to set it up first.
What is the Metrics Server?
The Kubernetes Metrics Server is a cluster-wide aggregator of resource usage data. The Kubernetes Metrics Server collects resource metrics from the kubelet running on each worker node and exposes them in the Kubernetes API server through the Kubernetes Metrics API.
In other words, it allows you to know how many resources (CPU, memory) are being consumed by the pods or nodes in a specific moment.
Why might I need to use metric server ?
Metric Server helps to the observability of the Cluster, from checking manually using kubectl to the Kubernetes dashboard, another monitor tool over the k8s cluster or even a custom tool to monitor our pods on the cluster. Whichever of the scenarios, the way to know the memory, and cpu consumption of a POD in a specific moment is by using metric server.
In production ready clusters (not Docker Desktop), it could be used to define policies for horizontal autoscaling Nodes. So, a new node could be added to the cluster if the existing node resources are over a defined threshold.
Metric Server Setup
It’s very straight forward, just copy the following snippet code and save it in a file with yaml extension. Then, let’s apply the file in your docker-desktop Kubernetes instance.
kubectl apply -f metric-server.yaml
This is the yaml file to copy…
apiVersion: v1
kind: ServiceAccount
metadata:
  labels:
    k8s-app: metrics-server
  name: metrics-server
  namespace: kube-system
---
apiVersion: rbac.authorization.k8s.io/v1
kind: ClusterRole
metadata:
  labels:
    k8s-app: metrics-server
    rbac.authorization.k8s.io/aggregate-to-admin: "true"
    rbac.authorization.k8s.io/aggregate-to-edit: "true"
    rbac.authorization.k8s.io/aggregate-to-view: "true"
  name: system:aggregated-metrics-reader
rules:
- apiGroups:
  - metrics.k8s.io
  resources:
  - pods
  - nodes
  verbs:
  - get
  - list
  - watch
---
apiVersion: rbac.authorization.k8s.io/v1
kind: ClusterRole
metadata:
  labels:
    k8s-app: metrics-server
  name: system:metrics-server
rules:
- apiGroups:
  - ""
  resources:
  - pods
  - nodes
  - nodes/stats
  - namespaces
  - configmaps
  verbs:
  - get
  - list
  - watch
---
apiVersion: rbac.authorization.k8s.io/v1
kind: RoleBinding
metadata:
  labels:
    k8s-app: metrics-server
  name: metrics-server-auth-reader
  namespace: kube-system
roleRef:
  apiGroup: rbac.authorization.k8s.io
  kind: Role
  name: extension-apiserver-authentication-reader
subjects:
- kind: ServiceAccount
  name: metrics-server
  namespace: kube-system
---
apiVersion: rbac.authorization.k8s.io/v1
kind: ClusterRoleBinding
metadata:
  labels:
    k8s-app: metrics-server
  name: metrics-server:system:auth-delegator
roleRef:
  apiGroup: rbac.authorization.k8s.io
  kind: ClusterRole
  name: system:auth-delegator
subjects:
- kind: ServiceAccount
  name: metrics-server
  namespace: kube-system
---
apiVersion: rbac.authorization.k8s.io/v1
kind: ClusterRoleBinding
metadata:
  labels:
    k8s-app: metrics-server
  name: system:metrics-server
roleRef:
  apiGroup: rbac.authorization.k8s.io
  kind: ClusterRole
  name: system:metrics-server
subjects:
- kind: ServiceAccount
  name: metrics-server
  namespace: kube-system
---
apiVersion: v1
kind: Service
metadata:
  labels:
    k8s-app: metrics-server
  name: metrics-server
  namespace: kube-system
spec:
  ports:
  - name: https
    port: 443
    protocol: TCP
    targetPort: https
  selector:
    k8s-app: metrics-server
---
apiVersion: apps/v1
kind: Deployment
metadata:
  labels:
    k8s-app: metrics-server
  name: metrics-server
  namespace: kube-system
spec:
  selector:
    matchLabels:
      k8s-app: metrics-server
  strategy:
    rollingUpdate:
      maxUnavailable: 0
  template:
    metadata:
      labels:
        k8s-app: metrics-server
    spec:
      containers:
      - args:
        - --cert-dir=/tmp
        - --secure-port=4443
        - --kubelet-preferred-address-types=InternalIP,ExternalIP,Hostname
        - --kubelet-use-node-status-port
        - --kubelet-insecure-tls
        image: k8s.gcr.io/metrics-server/metrics-server:v0.4.2
        imagePullPolicy: IfNotPresent
        livenessProbe:
          failureThreshold: 3
          httpGet:
            path: /livez
            port: https
            scheme: HTTPS
          periodSeconds: 10
        name: metrics-server
        ports:
        - containerPort: 4443
          name: https
          protocol: TCP
        readinessProbe:
          failureThreshold: 3
          httpGet:
            path: /readyz
            port: https
            scheme: HTTPS
          periodSeconds: 10
        securityContext:
          readOnlyRootFilesystem: true
          runAsNonRoot: true
          runAsUser: 1000
        volumeMounts:
        - mountPath: /tmp
          name: tmp-dir
      nodeSelector:
        kubernetes.io/os: linux
      priorityClassName: system-cluster-critical
      serviceAccountName: metrics-server
      volumes:
      - emptyDir: {}
        name: tmp-dir
---
apiVersion: apiregistration.k8s.io/v1
kind: APIService
metadata:
  labels:
    k8s-app: metrics-server
  name: v1beta1.metrics.k8s.io
spec:
  group: metrics.k8s.io
  groupPriorityMinimum: 100
  insecureSkipTLSVerify: true
  service:
    name: metrics-server
    namespace: kube-system
  version: v1beta1
  versionPriority: 100
Verifying Metric Server is already installed
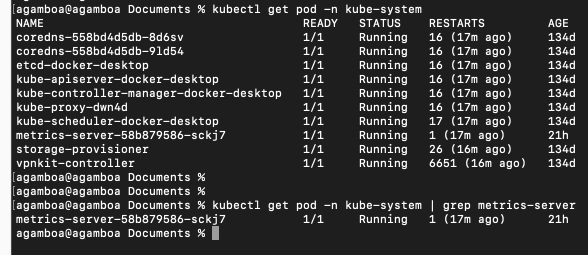
You should see a metric-server-XXXX pod running in the kube-system namespace.
kubectl get pods -n kube-system | grep metrics-server
References
- https://www.metricfire.com/blog/how-to-monitor-your-kubernetes-metrics-server/
- https://www.ibm.com/docs/en/spp/10.1.8?topic=prerequisites-kubernetes-verifying-whether-metrics-server-is-running
- https://kubernetes.io/docs/tasks/debug/debug-cluster/resource-metrics-pipeline/